Performing Color Measurement of Charts
The measurement instruments used in VersaWorks are grouped into the following five categories according to the way that they perform color measurement of charts.
- X-Rite i1Pro/i1Pro 2/i1Pro 3 and i1Pro 3 Plus
Perform color measurement manually with a board and ruler. The detailed operations are given under "Procedure."
- X-Rite i1iO/i1iO 2/i1iO 3 and i1iO 3 PlusPerform color measurement of charts automatically with an automatic measurement table. Perform color measurement as directed in the instructions shown in VersaWorks. The main features are listed below.
- The height of the measurement instrument (the media thickness) is adjusted with the arm axis.
- Three color measurement positions are specified manually.
- The measurement instrument is calibrated and color measurement is performed automatically.
- X-Rite i1iSis
Measure color charts automatically. To perform color measurement, just insert the color chart into the device according to the procedure in VersaWorks.
- Barbieri Spectro LFP qb
To automatically detect positions and perform color measurement, just set the chart on the table and perform operations according to the instructions shown in VersaWorks.
- Barbieri Spectro padPerform color measurement as directed in the instructions shown in VersaWorks and on the touch screen (Barbieri). The main features are listed below.
- Color measurement is performed by matching the infrared ray emitted by the measurement instrument with the row whose color will be measured.
- The speed at which the measurement instrument moves is adjusted with a speed meter.
- The color measurement direction can be specified.
- Print the chart without any nozzle drop-out.
- Dry the chart thoroughly.
This section provides the procedure for performing color measurement of a profile chart using the X-Rite i1Pro 3.
- Set the measurement instrument.
- Print the color chart.
The required color chart varies depending on the purpose, such as color matching or the nearest color finder. The main points for color measurement are the same.
- Perform color measurement.
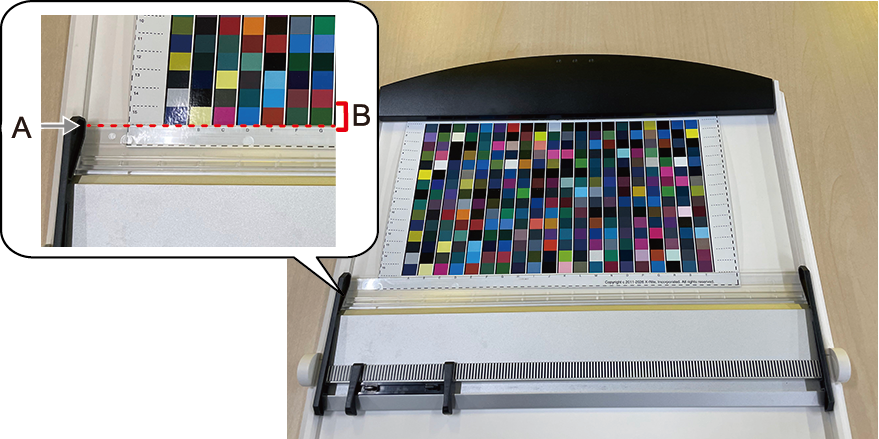
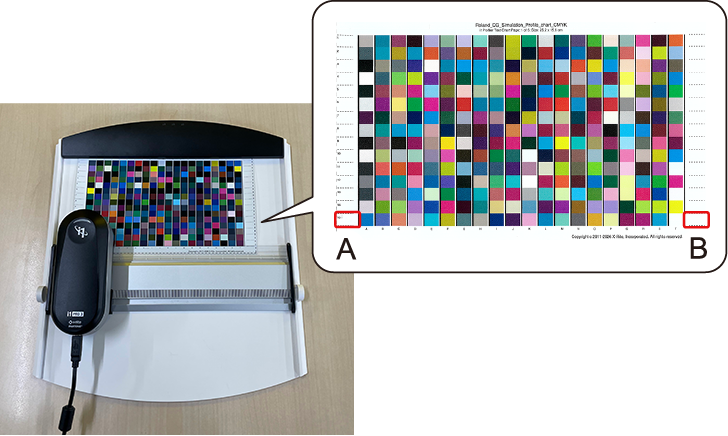
- Attach the chart to the backing board, and then set the scanning ruler in place.Align the top edge of the scanning ruler (A) with the bottom edge of the lowest chart row (B). Color measurement is performed from the bottom up to avoid scratching or soiling the patches that have not yet been measured.
- Calibrate the measurement instrument.Calibrate the measurement instrument as directed in the instructions shown in the VersaWorks window. Set the measurement instrument in place on the calibration plate, and then click Calibrate.
Figure 1. Preparing the calibration plate 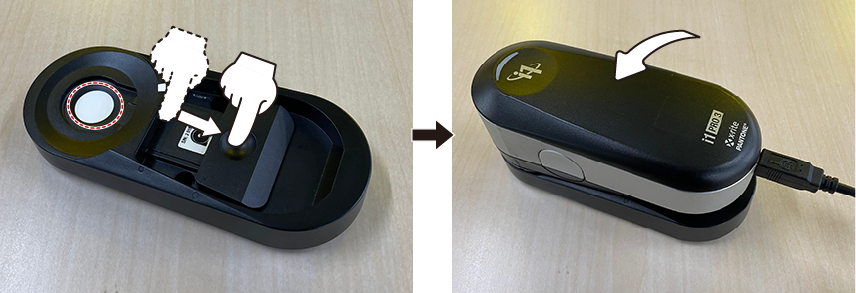
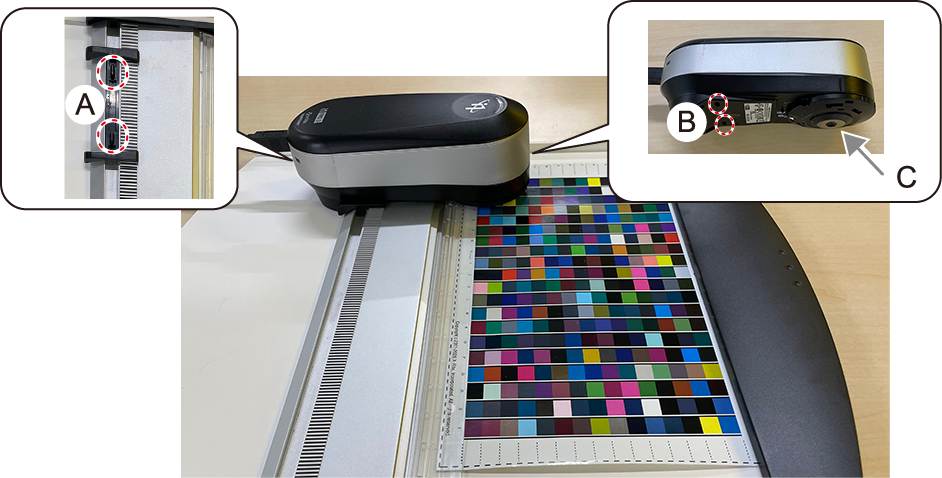
- Attach the measurement instrument to the scanning ruler.If you align the protrusions on the ruler (A) with the holes on the measurement instrument (B) and attach the measurement instrument, the measurement unit of the measurement instrument (C) will be aligned with the chart row on which to perform color measurement.
- Place the measurement instrument at the starting position of the chart.
- The starting position (A) is to the left of the leftmost black line on the chart. The ending position (B) is to the right of the rightmost black line.
 MEMO For charts other than profile charts, the starting and ending positions are the same as described above.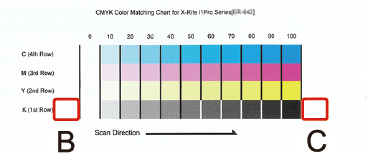
- The starting position (A) is to the left of the leftmost black line on the chart. The ending position (B) is to the right of the rightmost black line.
- Follow the procedure below to perform color measurement.
- Click Measure.
- Press the button at the starting position (A).
- With the button pressed, slowly move to the ending position (B). (Guideline: approximately 10 cm [3.94 in.] per second)
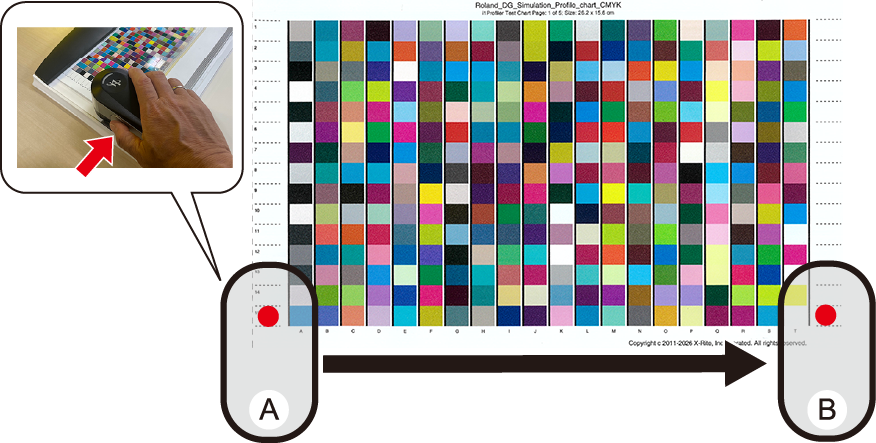
- Release the button.
- The result of the color measurement is displayed in VersaWorks.
- If color measurement failed, perform color measurement again as directed in the instructions shown in the window.
- Perform color measurement on all the rows.
- Attach the chart to the backing board, and then set the scanning ruler in place.
Chart list
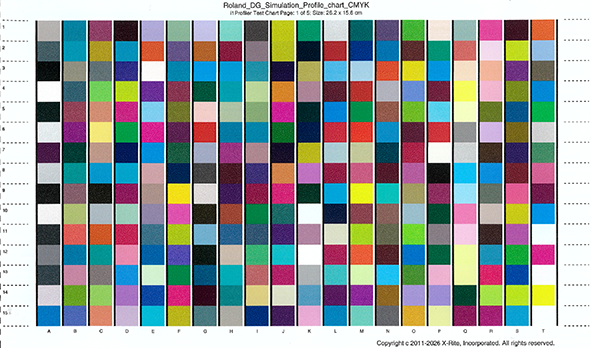
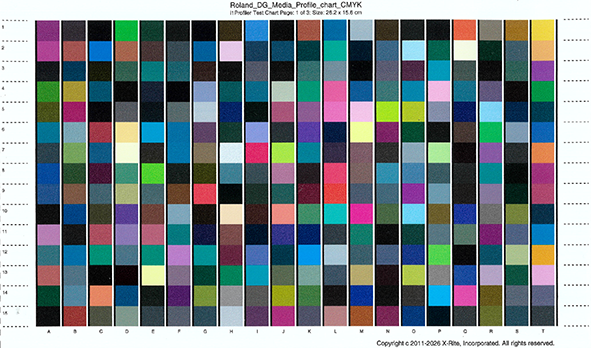
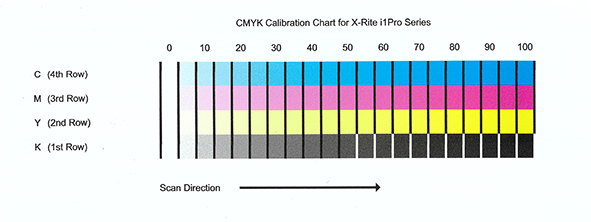
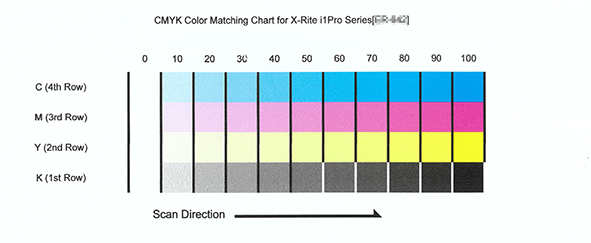
As a reference, this section displays the charts that are used in VersaWorks. The actual color charts may vary from what is shown here due to the model, ink type, and similar factors.
- Profile chartUse this chart to create a simulation profile or a media profile.
- Calibration chartUse this chart to measure the ink density.
- Color matching chartUse this chart when creating Reference Printer Data or Target Printer Data.
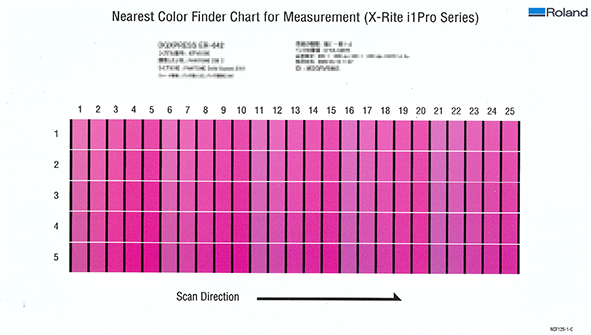
- Color measurement chart for the nearest color finderUse this chart for color measurement with the nearest color finder that adjusts the output color of spot colors.