Step 2: Prepare to Create a Profile
Procedure
-
Set the measurement instrument.
Set it to make it ready to perform the measurement.
- Select the media you created.
-
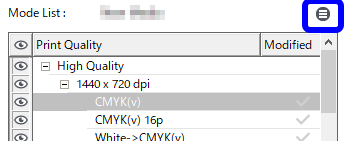
Select the printing quality mode that will be used for the selected media from the Mode List.
- Variable dot modes (modes that use dots of varying sizes) have "(v)" next to their name. Modes without "(v)" next to their name are printed using dots of a fixed size.
- Halftone printing mode is available in some of the modes that use fixed dots (the Halftone setting becomes Angled Screen).
- Clear the Hide Non-recommended Modes check box to display all the available modes. You can show/hide the modes by clicking
 .
.
-
Click
 .
.
 The display of the window changes.
 -
Configure the Quality Settings.
- Click Print Quality under Quality Settings.
- If necessary, set the Direction, Head Speed, and Feed Speed. (Configure the Halftone Options if [Halftone] is set to [Angled Screen]. The options include Frequency, Dot Shape, and Angle.)
-
Configure the Calibration Settings.
-
Click Print Chart under Calibration Settings, and then click Print.
The following message appears: "The following job will be printed. Do you want to continue?"IMPORTANT: Check whether the media loaded in the printer is large enough for the displayed page size.
-
Click OK.
The swatch used for density measurement is printed.
The swatch pattern varies depending on the selected measurement instrument.
-
Click Measure Chart under Calibration Settings, and then click Calibrate.
The measurement instrument is calibrated.
- Set the swatch used for density measurement (printed in steps a and b) on the measurement instrument, and then click Measure.
- Follow the on-screen instructions to start the measurement.
-
When the measurement is finished, click
 to save the measurement results.
The Save As window appears.
 - Enter the file name, select the labt file in File type, and then click Save….
- Click Fine Tune and Apply under Calibration Settings.
- Select Channel, and then check the density curve for each measurement data channel.
- If the slopes of the density curves are always positive, click Apply.
-
If the slope of any portion of a density curve is zero or negative, adjust the curve so that its slope is always positive, and then click Apply.

- To adjust the curve, click the Output value that you want to adjust, and then overwrite the density (percentage) value.
-
Click Print Chart under Calibration Settings, and then click Print.
-
Set the Total Ink Limit.
-
Click Print Chart under Total Ink Limit, and then click Print.
The following message appears: "The following job will be printed. Do you want to continue?" Check whether the media loaded in the printer is large enough for the displayed page size.
-
Click OK.
The ink limit chart is printed.
- Check for oversaturation, bleeding, and ink drying on the printed chart to determine the total ink limit.
- Click Set Ink Limit under Total Ink Limit, and then enter the total ink limit that you determined in the previous step into Total Ink.
-
Click Print Chart under Total Ink Limit, and then click Print.
-
Click OK.
The display of the window changes.
-
Click OK.
A confirmation window appears to confirm that you want to apply the changes.
-
Click Yes.
The settings of the new media are saved.IMPORTANT: Be sure to click Yes. Clicking No closes the window without saving the settings of the new media.
 Step 3: Create a Profile

